Clinical Partnership
Whitepaper
Precision ADHD Care Through
Wearable Biomarkers
A Guide for Psychiatrists and Telepsychiatry Practices
Table of Contents
- Executive Summary3
- Section 1: The Science of ADHD Biomarkers4
- Section 2: Precision Titration Protocol7
- Section 3: Clinical Dashboard Walkthrough10
- Section 4: Patient Mobile Experience12
- Section 5: Revenue & Incentive Model14
- Section 6: Partnership Benefits16
- Section 7: Implementation & Next Steps18
Executive Summary
ADHD affects over 10 million adults in the United States, yet treatment optimization remains largely subjective. Clinicians rely on patient self-reports during brief quarterly visits, leading to prolonged titration periods, suboptimal dosing, and poor outcomes.
Attunio changes this paradigm by integrating continuous wearable biomarker data into clinical decision-making. Our platform transforms ADHD care from reactive guesswork into proactive, data-driven precision medicine.
Section 1: The Science of ADHD Biomarkers
The Problem with Subjective Assessment
Traditional ADHD management relies on patient recall, subjective rating scales, and 15-minute visits every 1-3 months. The result: average time to optimal dose is 4-6 months. Many patients never reach it.
Objective Biomarkers for ADHD
Peer-reviewed research has identified physiological markers that correlate strongly with ADHD symptom severity:
Heart Rate Variability (HRV)
| Study | Finding | Accuracy |
|---|---|---|
| Frontiers in Psychiatry (2024) | Multi-parametric HRV model discriminates ADHD | 85.5%, AUC 0.95 |
| Rahman et al. (2025) | Fitbit-derived HRV predicts ADHD | 89%, AUC 0.95 |
Clinical Significance: Lower HRV correlates with increased inattention and emotional dysregulation. HRV improvements track with treatment response.
Sleep Architecture
| Metric | ADHD Pattern | Clinical Implication |
|---|---|---|
| REM Sleep | Often reduced (14-18% vs. 20-25% target) | Impacts emotional regulation |
| Sleep Latency | Extended (>20 minutes) | Indicates hyperarousal |
| WASO | Elevated (>30 minutes) | Worsens next-day symptoms |
| Sleep Efficiency | Reduced (<85%) | Overall quality marker |
Glucose Metabolism
Emerging research indicates ADHD brains show altered glucose metabolism in the prefrontal cortex:
- Glucose spikes correlate with hyperactivity and restlessness
- Glucose crashes correlate with brain fog and inattention
- Stable glucose (80-100 mg/dL) correlates with optimal focus
- Stimulant medications work partly by normalizing glucose utilization
The Attunio Focus Score
Our proprietary algorithm synthesizes multiple biomarker streams into a single, actionable metric:
Biomarker Inputs
Proprietary weighting algorithm calibrated against clinical outcomes data.
| Focus Score | Interpretation |
|---|---|
| 85-100 | Excellent — treatment optimized |
| 70-84 | Good — minor adjustments may help |
| 50-69 | Fair — treatment review recommended |
| <50 | Needs attention — intervention indicated |
Section 2: Precision Titration Protocol
Traditional vs. Attunio Protocol
| Traditional Approach | Attunio Protocol |
|---|---|
| Start low, increase every 2-4 weeks | Start low, data-guided adjustments |
| Patient reports "I feel better/worse" | Objective biomarker trends |
| 4-6 months to optimal dose | Weeks, not months |
| No data between visits | Continuous monitoring |
The Titration Journey
Phase 1: Baseline
Patient connects wearable, optional CGM integration, platform collects baseline data, Focus Score established.
Phase 2: Initiation
Medication started, continuous monitoring tracks Focus Score changes, HRV response, sleep impact, heart rate.
Phase 3: Optimization
Data-guided dose adjustments based on biomarker signals. Timeline varies by patient response.
Phase 4: Maintenance
Ongoing summaries, automated alerts, periodic reviews, early detection of tolerance.
Clinical Decision Support Example
Algorithm Assessment: "Optimal Dose Detected: Current 20mg dose shows best balance of efficacy (85 Focus Score) with manageable side effects. Consider maintaining this dose for 4-6 weeks before reassessment."
Section 3: Clinical Dashboard Walkthrough
The Attunio clinician dashboard (clinician.attunio.co) provides comprehensive patient management with real-time biomarker tracking, medication response monitoring, and AI-powered insights.
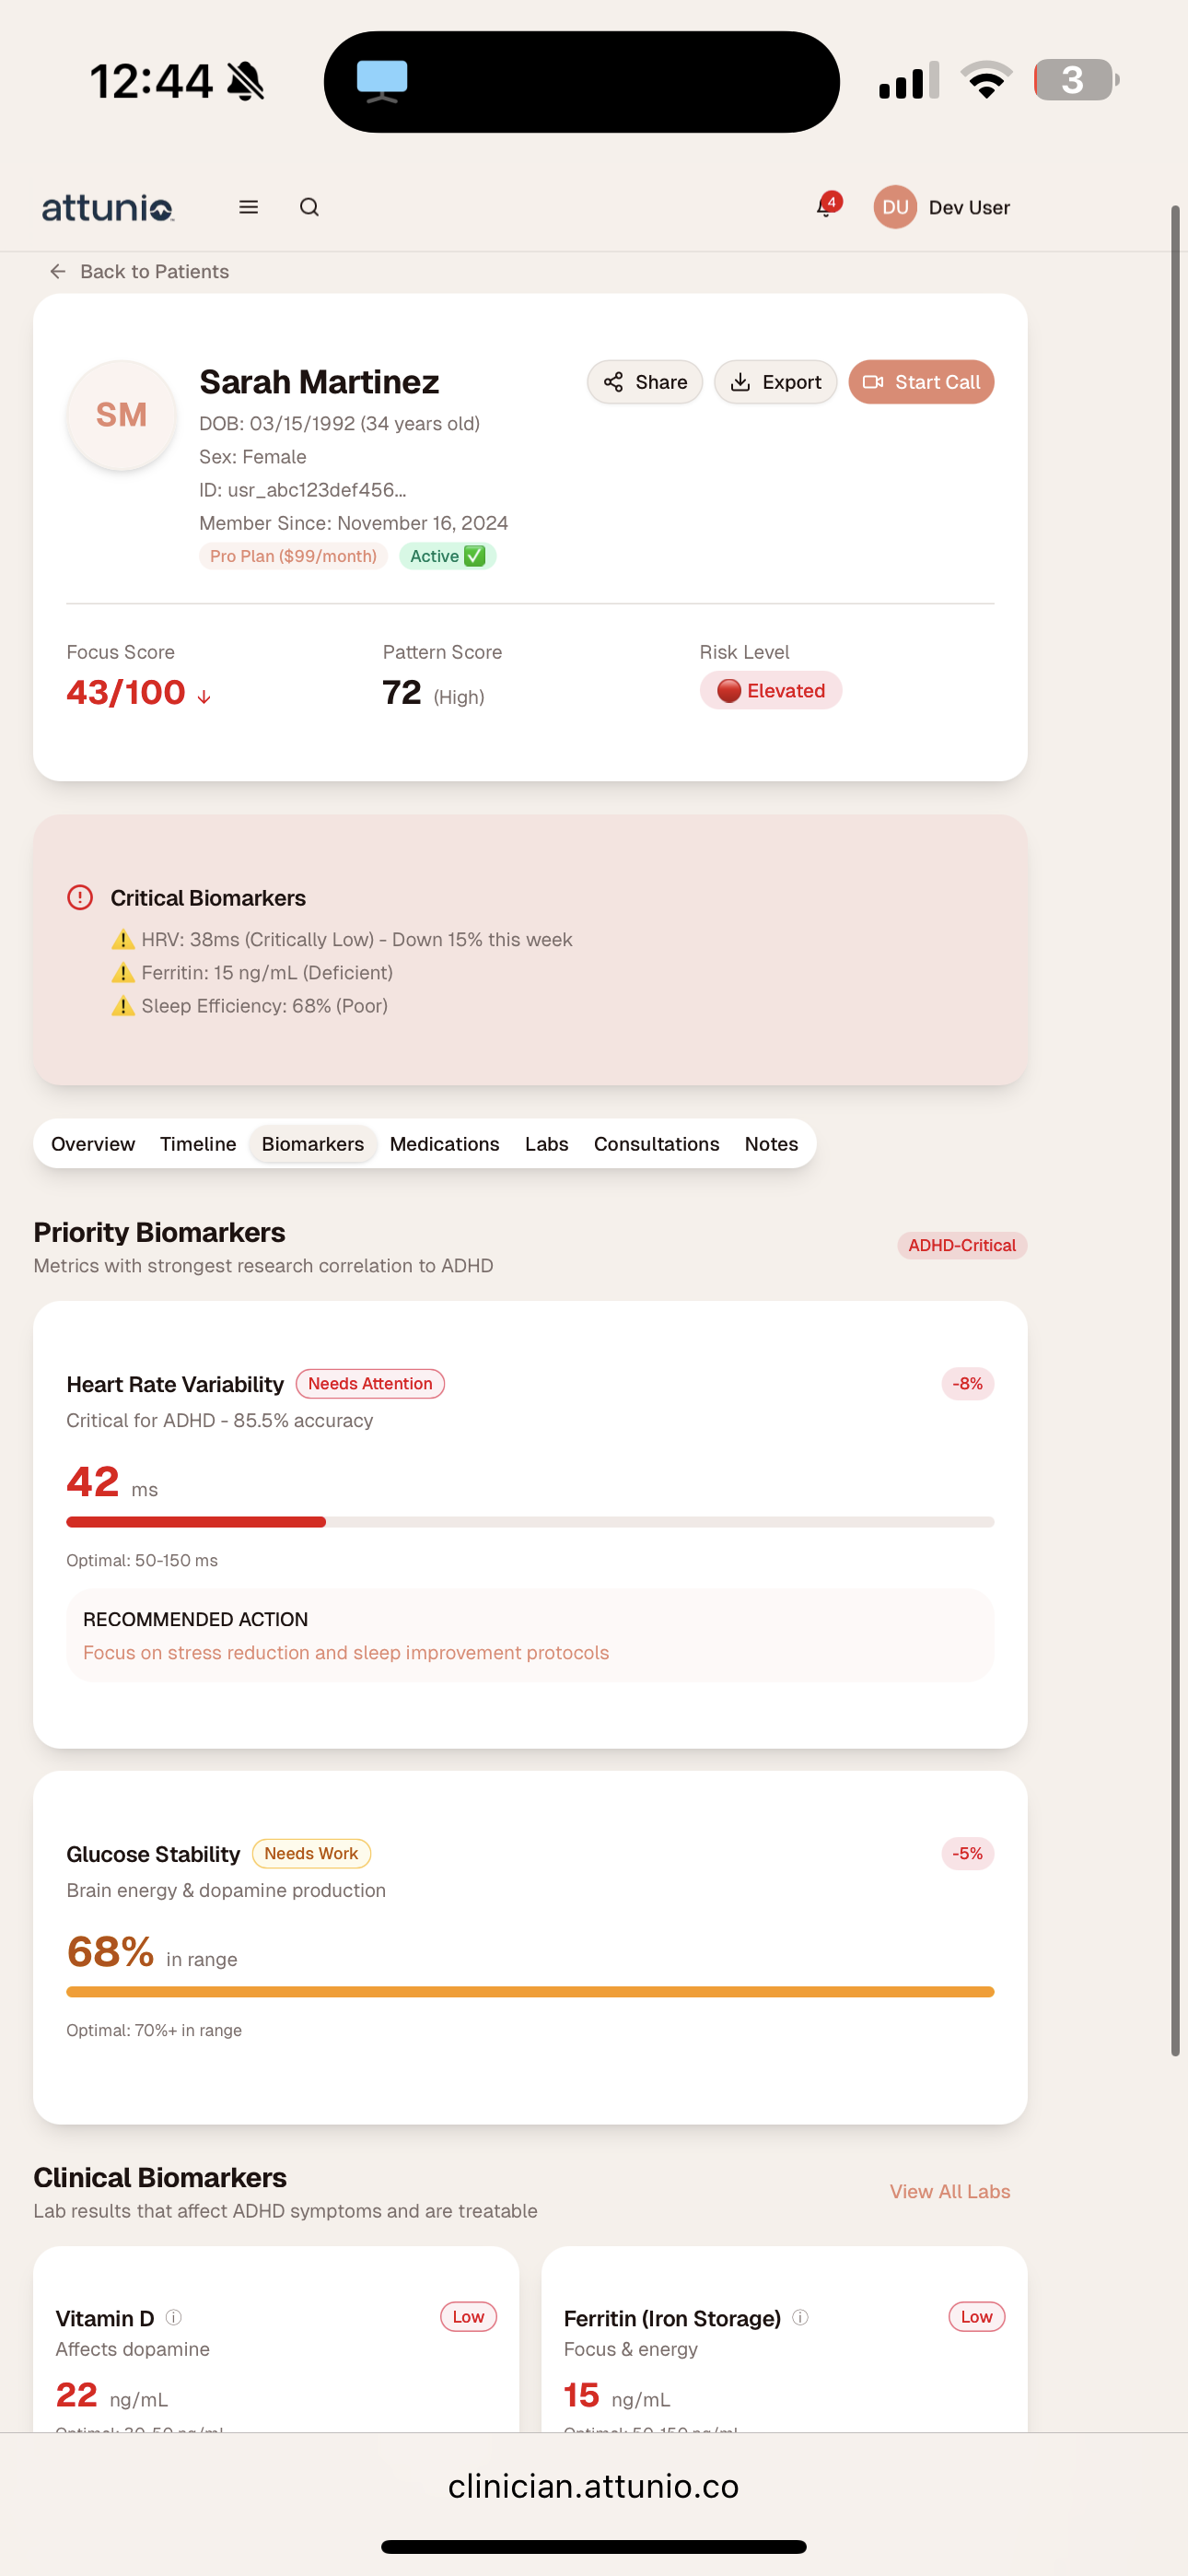
Patient Biomarkers
Focus Score, HRV, glucose stability, and critical biomarker alerts with recommended actions.
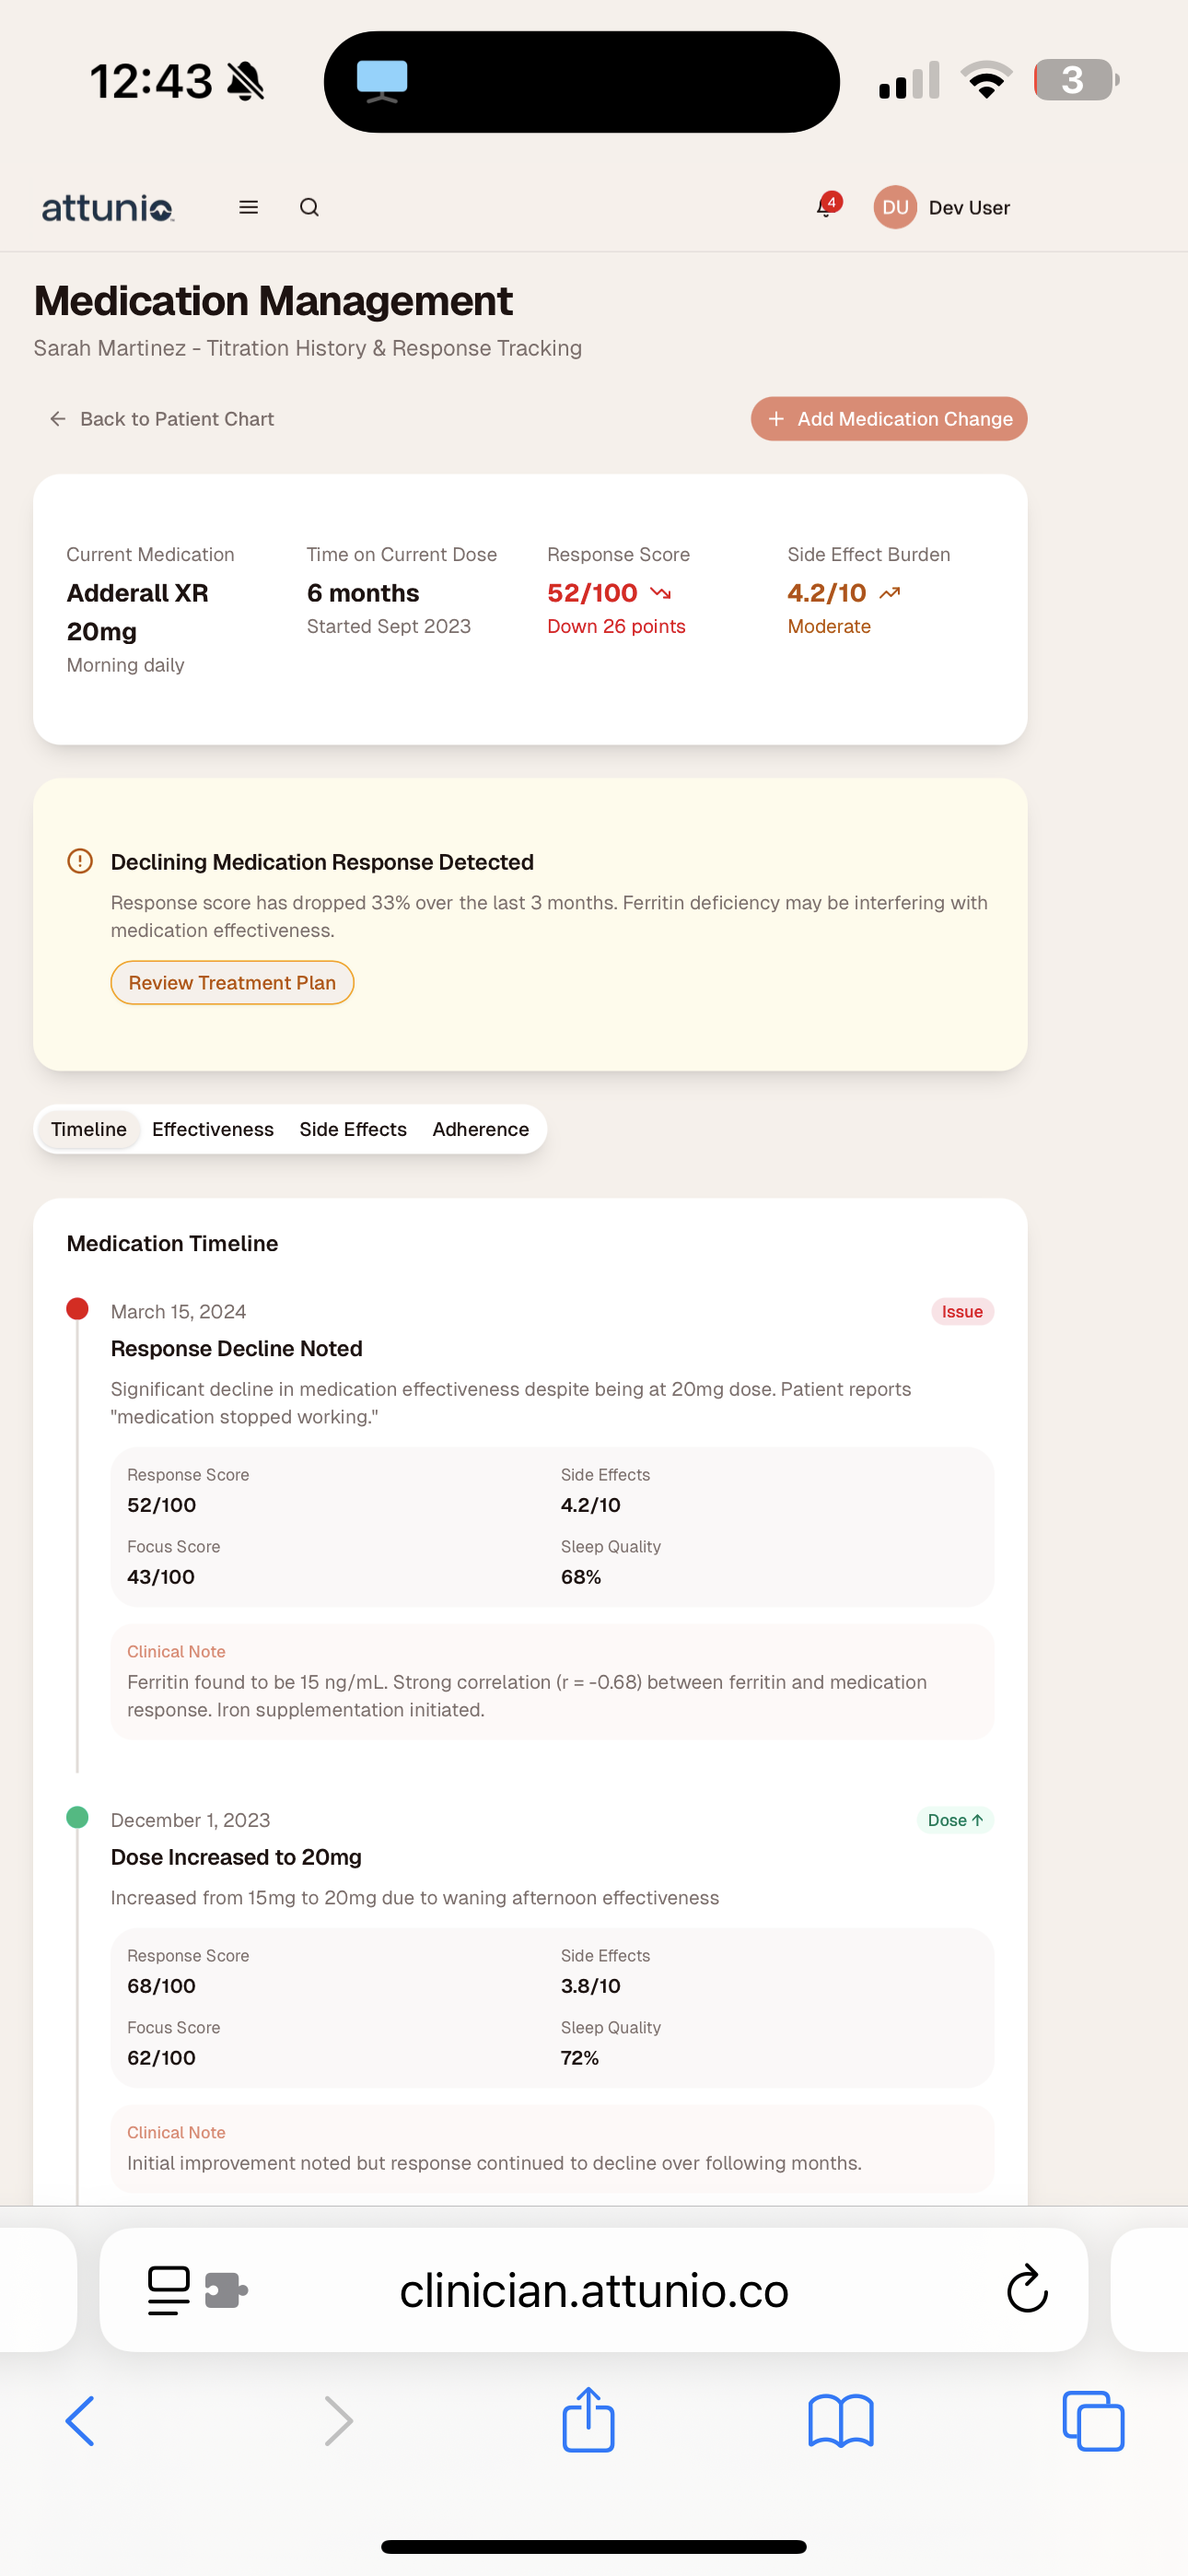
Medication Timeline
Track response scores, clinical notes, and auto-detect declining medication effectiveness.
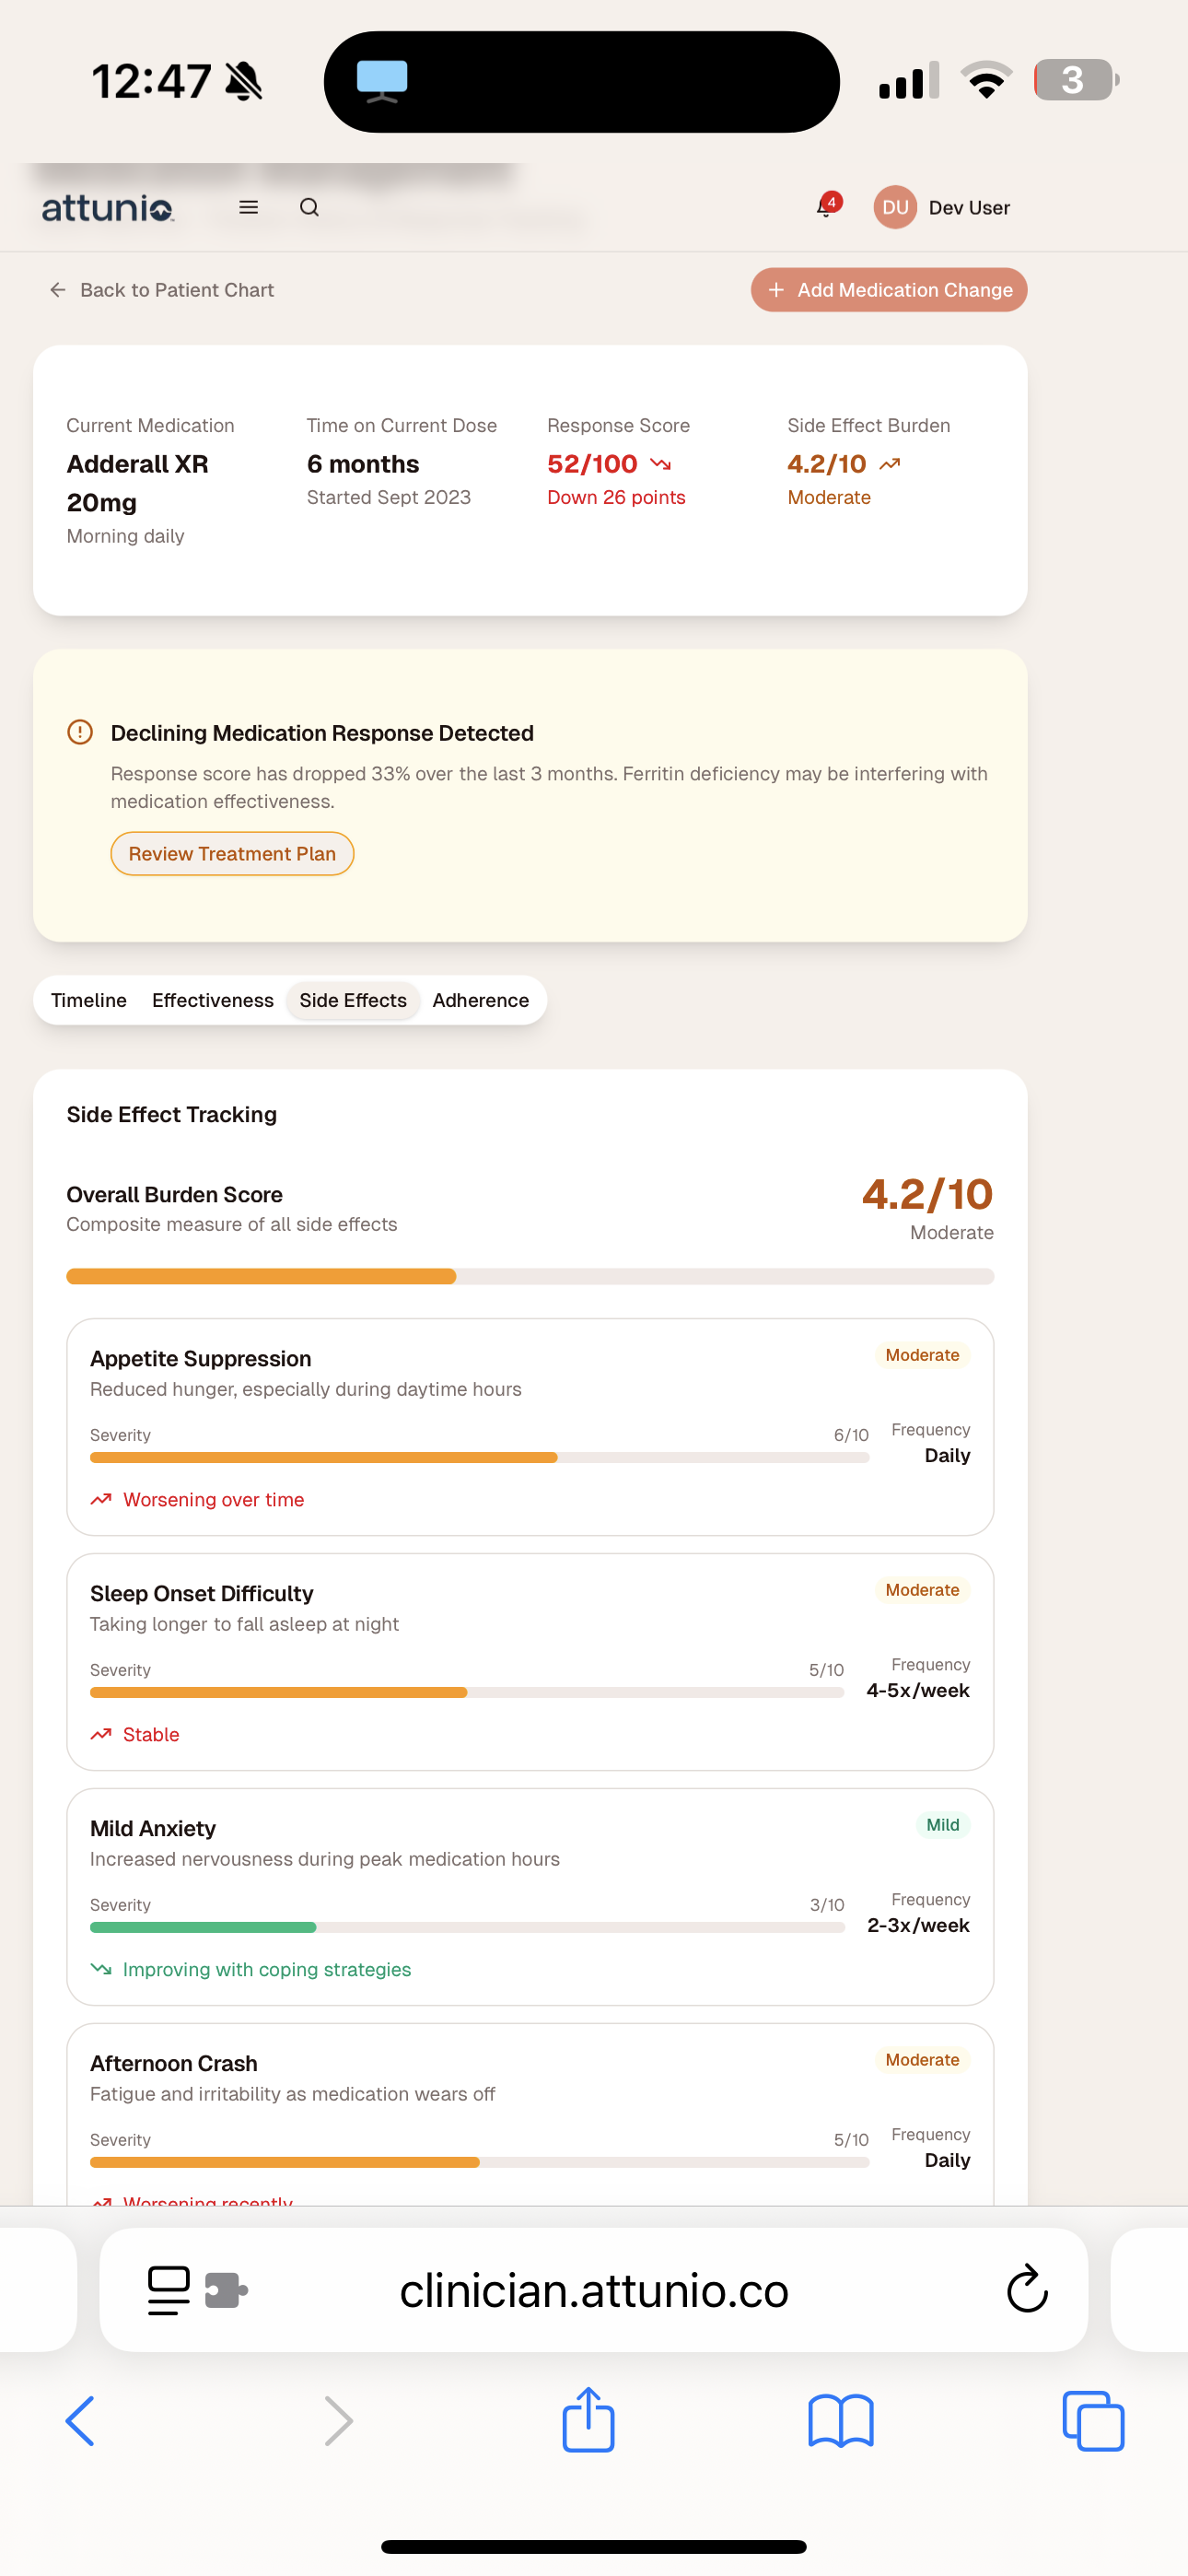
Side Effect Tracking
Monitor appetite, sleep, anxiety with severity scores and trend indicators.
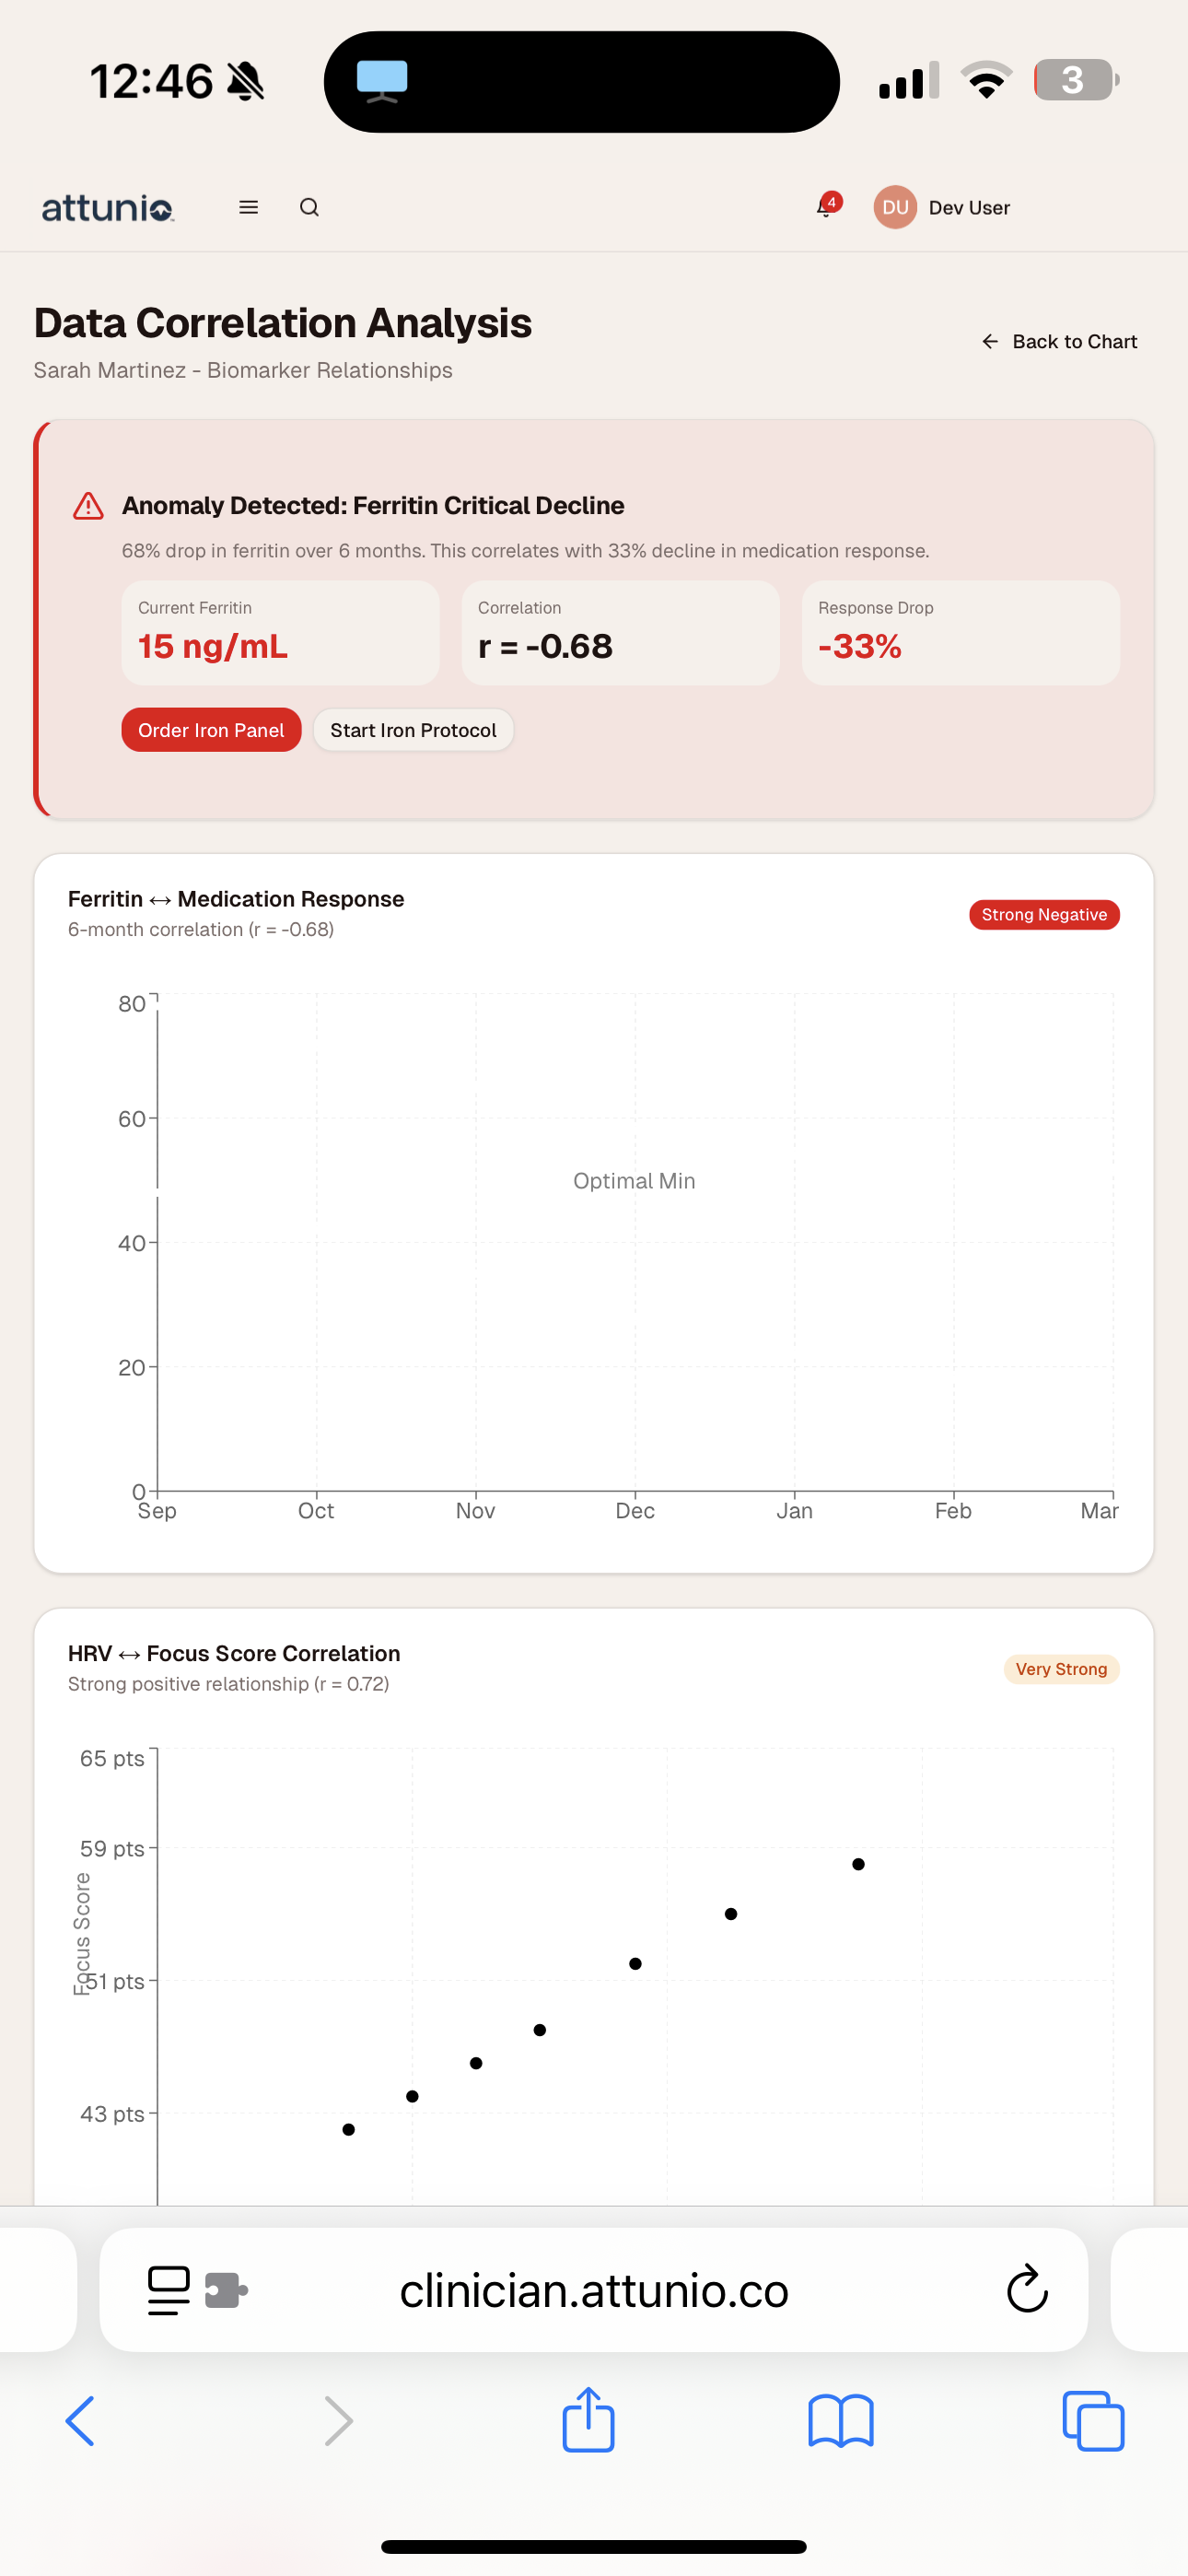
Correlation Analysis
AI-detected anomalies with ferritin-medication and HRV-focus correlation charts.
Key Correlations Panel
The platform automatically detects research-backed correlations in each patient's data:
| Correlation | Coefficient | Clinical Insight |
|---|---|---|
| HRV ↔ Inattention Score | -0.28 | Lower HRV predicts worse focus days |
| Glucose Stability ↔ Focus | 0.62 | Stable glucose predicts good focus |
| REM Sleep ↔ Executive Function | 0.54 | REM disruption impacts decisions |
| Ferritin ↔ Restless Legs | -0.71 | Low iron predicts sleep disruption |
Lab Integration
Attunio integrates blood biomarkers relevant to ADHD:
| Biomarker | Optimal Range | ADHD Relevance |
|---|---|---|
| Ferritin | 50-150 ng/mL | Low iron linked to restless legs, poor focus |
| Vitamin D | 30-50 ng/mL | Deficiency = increased impulsivity |
| TSH | 0.5-2.5 mIU/L | Thyroid dysfunction mimics ADHD |
| Magnesium | 1.7-2.2 mg/dL | Deficiency worsens hyperactivity |
Generate Doctor Report
One-click report generation for patient records, insurance prior authorizations, referrals, and treatment summaries with objective biomarker data.
Section 4: Patient Mobile Experience
The Attunio patient app provides a seamless experience for medication tracking, symptom logging, and titration monitoring. Patients can easily log doses, track side effects, and view their treatment progress—all while generating objective biomarker data for clinical decision-making.
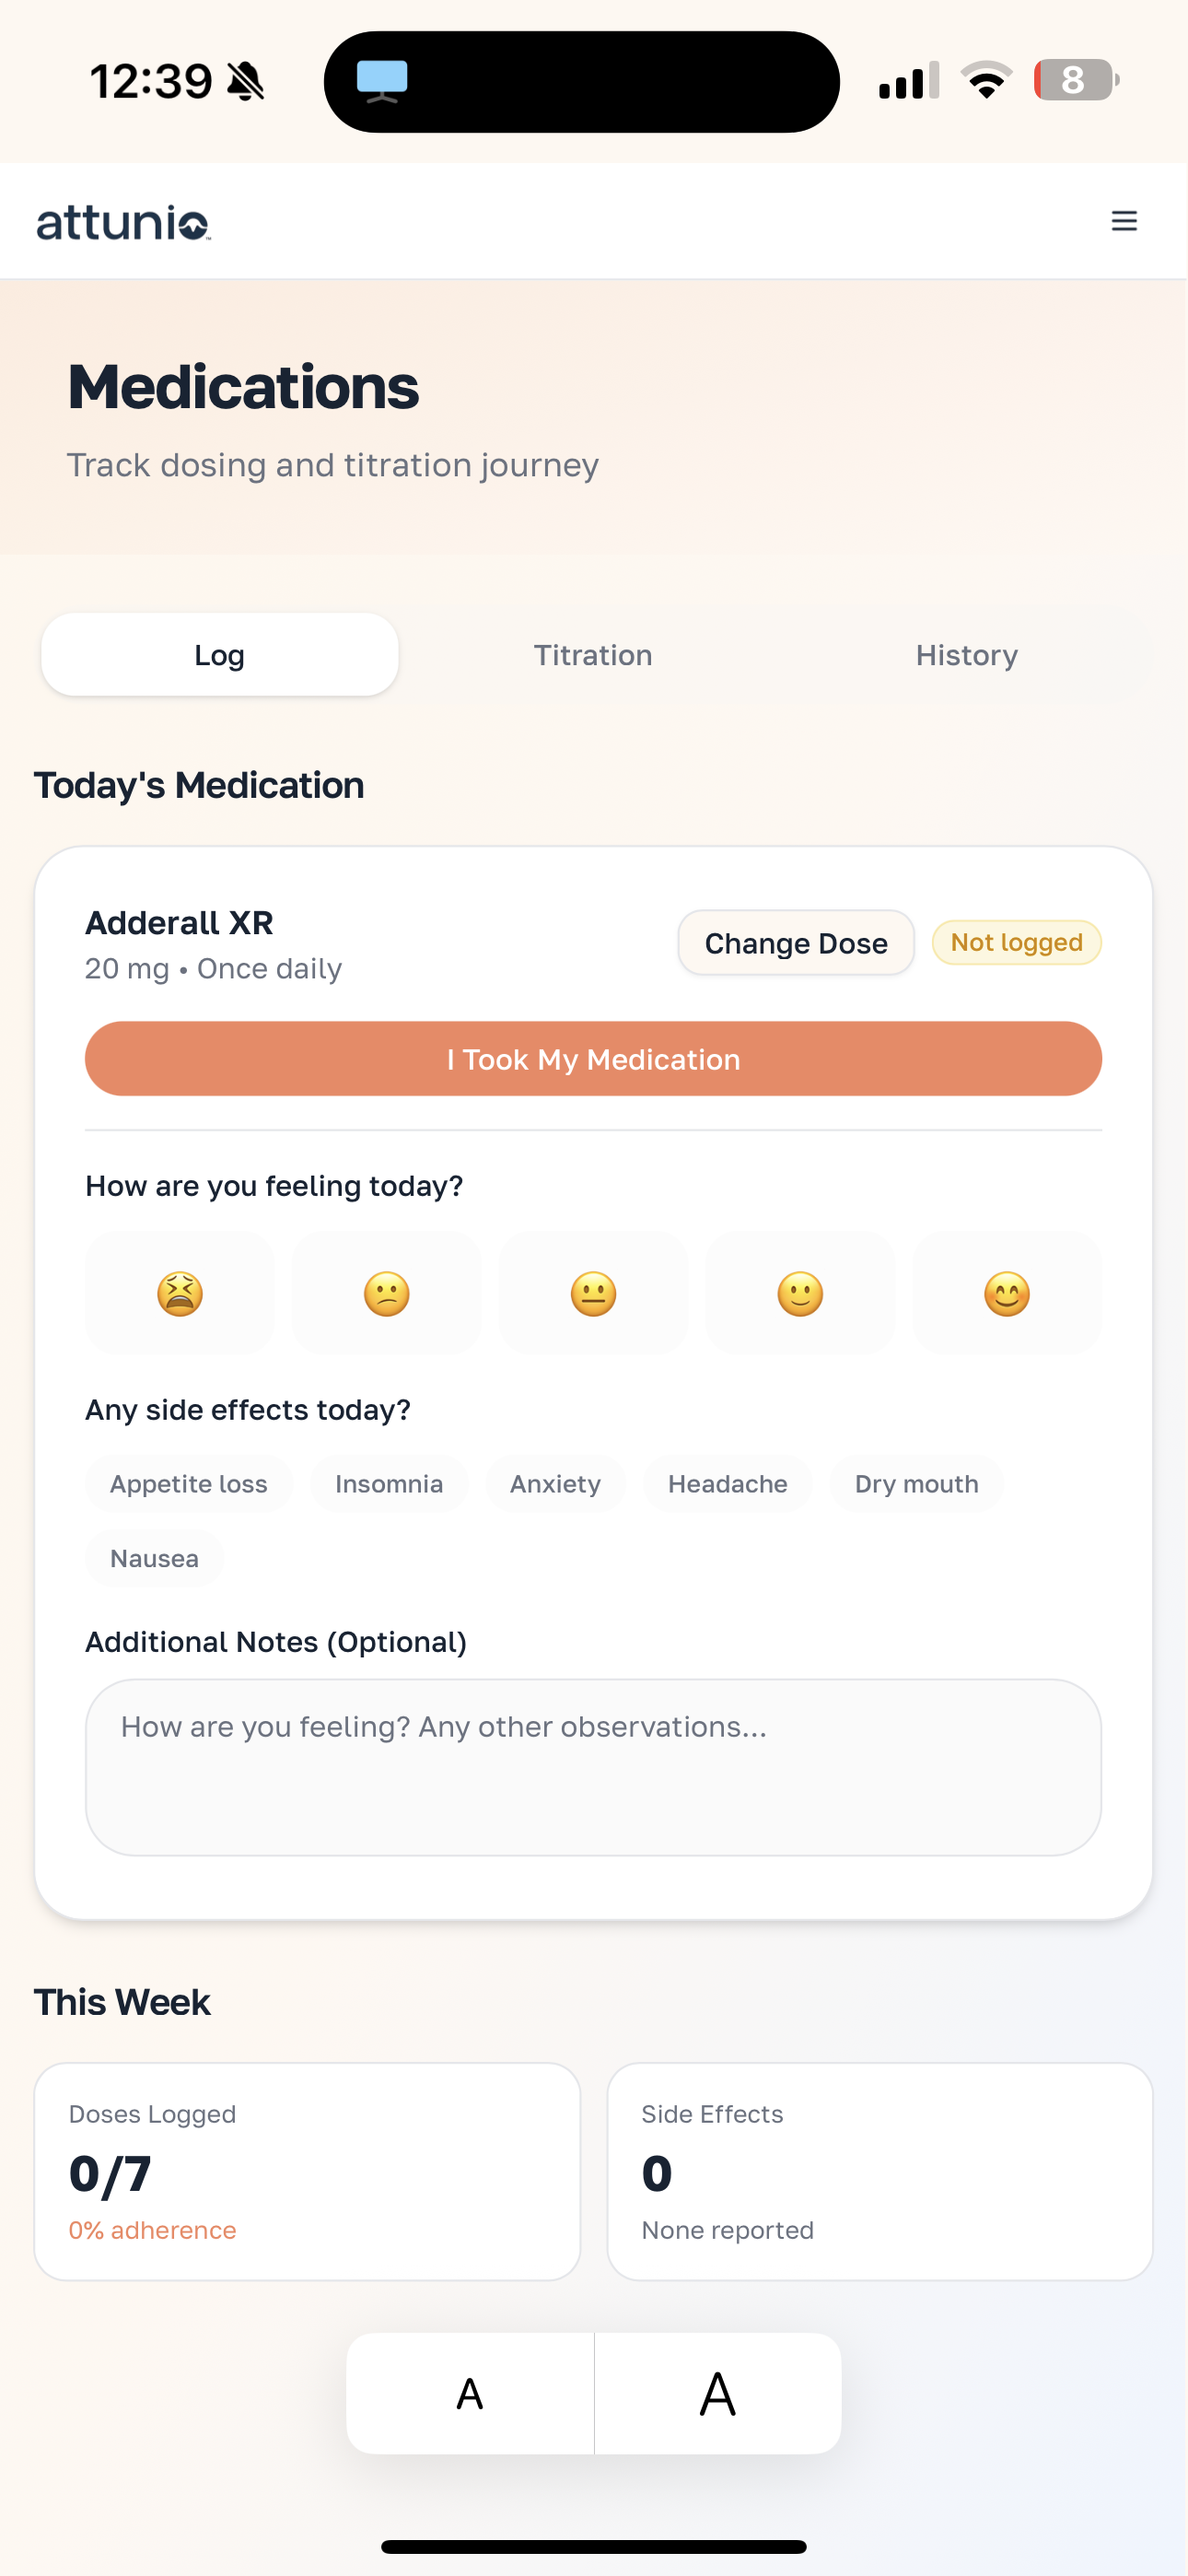
Daily Medication Logging
One-tap medication tracking with mood assessment and side effect reporting for comprehensive daily insights.
Titration Journey
Visual dose comparison with biomarker trends (Focus, HRV, Sleep, HR) and AI-powered optimal dose detection.
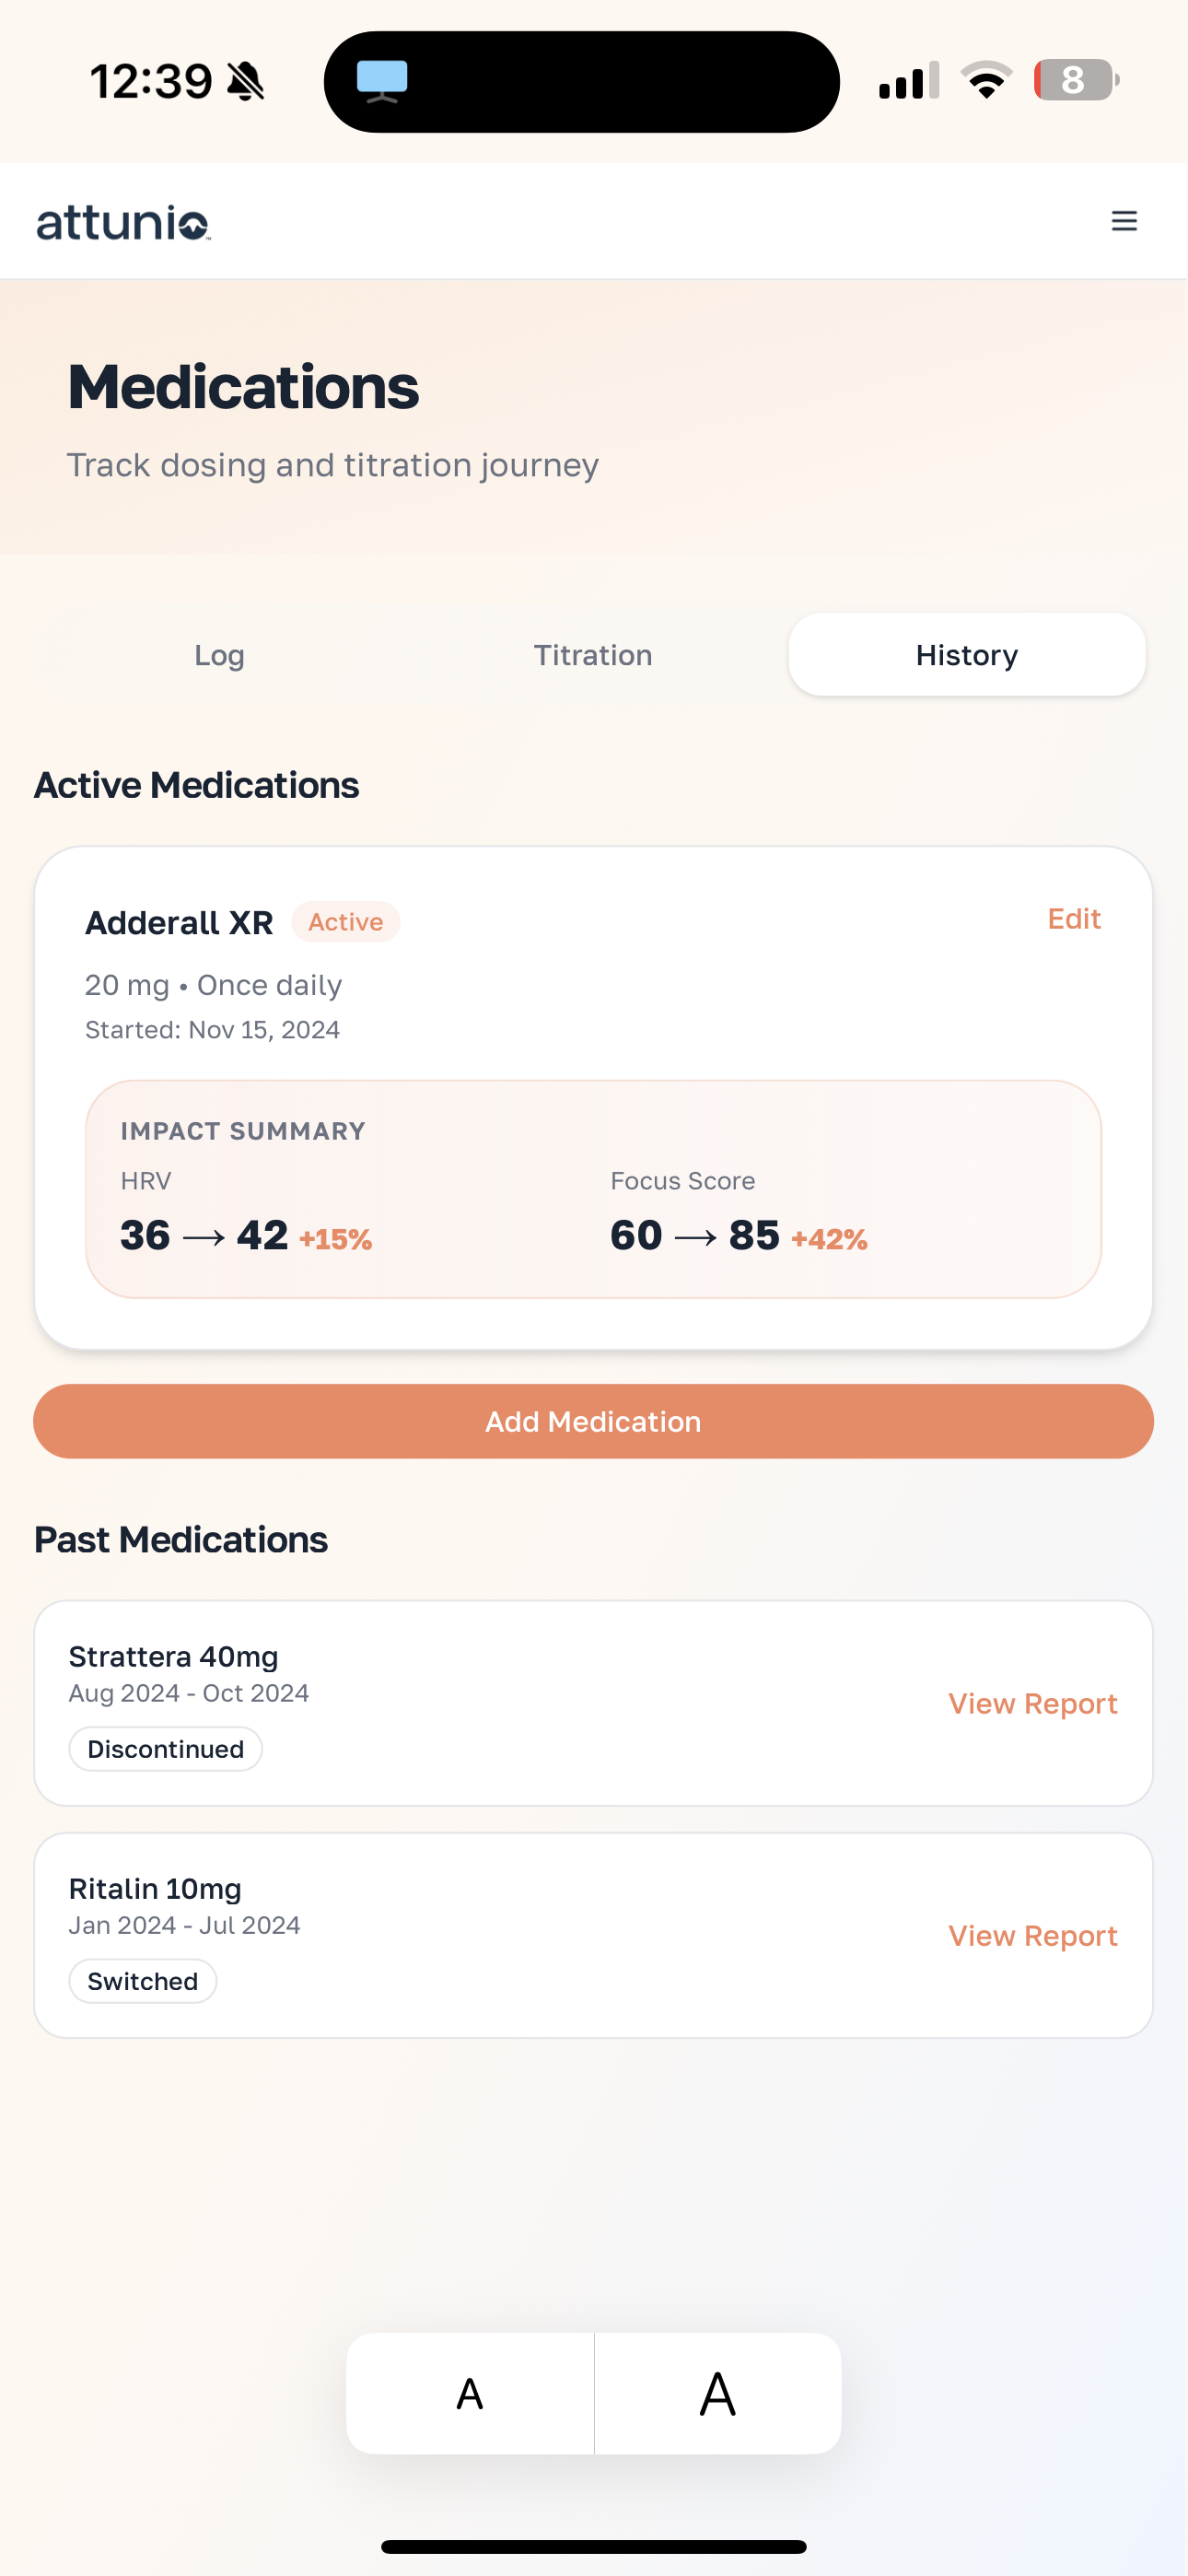
Treatment History
Complete medication history with impact summaries showing HRV and Focus Score improvements over time.
Patient App Key Features
One-Tap Dose Logging
Quick daily medication confirmation with timestamps
Biomarker Trends
Visual progress tracking for Focus, HRV, Sleep quality
Mood & Side Effect Tracking
5-point mood scale with common side effect chips
AI Optimal Dose Detection
Automated analysis identifies best-performing dosage
Section 4: Revenue & Incentive Model
Partnership Tiers
| Tier | Best For | Revenue Share | Cost |
|---|---|---|---|
| Referral Partner | Individual practitioners | 20% | Free |
| Clinical Partner | Group practices | 25% | Free |
| Strategic Partner | Health systems | Up to 30% | Custom |
Revenue Projections for Partners
| Patients Referred | Monthly Revenue (25%) | Annual Revenue |
|---|---|---|
| 25 | $1,250 | $15,000 |
| 50 | $2,500 | $30,000 |
| 100 | $5,000 | $60,000 |
| 250 | $12,500 | $150,000 |
| 500 | $25,000 | $300,000 |
Additional Revenue: Lab Services
Lab Panel Commissions: Partners earn additional revenue through our comprehensive ADHD biomarker panels. Commission rates and pricing details are available during partnership onboarding discussions.
Section 5: Partnership Benefits
Revenue Sharing
Up to 30% recurring revenue per referred patient. No caps, no minimums. Monthly payouts with transparent tracking.
Free Clinical Dashboard
Real-time patient biomarker data, Focus Score tracking, titration tools, and one-click reports at no cost.
Research Access
Co-author papers, access de-identified datasets, IRB support, and publication assistance.
CME Credits
Earn credits through training programs, biomarker certification, and annual conferences.
Practice Differentiation: Offer what other practices can't. "We use biomarker-guided precision ADHD care" sets you apart from every competitor.
Section 6: Implementation & Next Steps
Timeline
| Phase | Timeline | Activities |
|---|---|---|
| Onboarding | Week 1-2 | Account setup, dashboard training, EHR integration |
| Pilot | Week 3-4 | First 10-25 patients, daily support, optimization |
| Scale | Month 2+ | Full rollout, revenue sharing begins |
Ready to Partner?
Join the future of precision ADHD care.
Email: partners@attunio.co
Website: attunio.co/partners
Schedule a DemoReferences
- Rahman et al. (2025). "Unlocking the potential of wearable technology: Fitbit-derived measures for predicting ADHD in adolescents." Frontiers in Child and Adolescent Psychiatry. n=450, 89% accuracy.
- "Physiological parameters to support ADHD diagnosis in children: a multiparametric approach." Frontiers in Psychiatry (2024). 85.5% accuracy, AUC 0.95.
- Kooij et al. (2019). "Updated European Consensus Statement on diagnosis and treatment of adult ADHD." European Psychiatry.
- Bijlenga et al. (2019). "The role of the circadian system in ADHD." Attention Deficit and Hyperactivity Disorders.